The paper's claim, and what came back
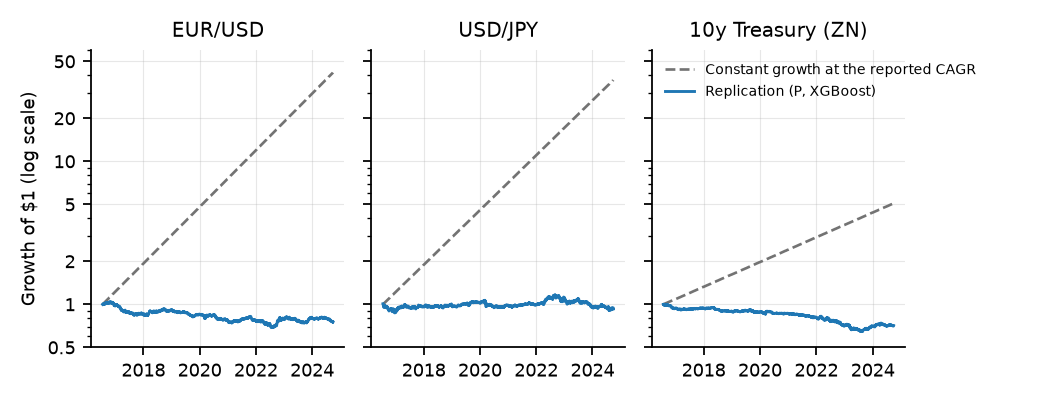
XGBoost, pooled out of sample from mid-2016 to September 2024, net of costs, using the timing the paper describes (variant P).
Paper figures are as reported (Sharpe and win rate, Table 1 of the paper). Replication figures are from results/F1_results.csv. The one-sided p-value is a 21-day block bootstrap.
All 18 combinations
Three assets, three timing variants and two models. P feeds the model the news dated the same day, as the paper describes. S uses only news published before the close (strict). L feeds the model the next day's news, a deliberate look-ahead. Filter, sort, and compare each Sharpe with the paper's and with random trading.
Select a dot for detail.
Sharpe is annualised on the pooled out-of-sample daily returns. "Random-sign p95" is the 95th percentile of 20 random-sign strategies on the same days at identical costs. Where the twins are negative (ZN), frequent position changes at 0.05% per round trip are costly.
Growth of $1
The replication's XGBoost strategy under the paper's timing, net of costs, on a log scale. The dashed line is constant growth at the paper's reported CAGR over the same dates, drawn for scale only; it is not the original's equity curve.
The news-timing hypothesis was rejected, and one candidate explanation
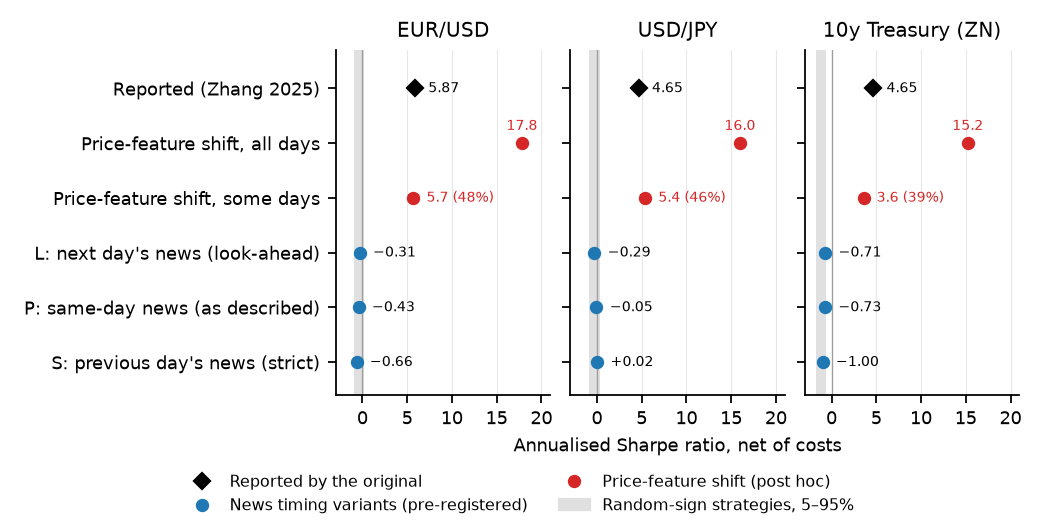
The pre-registered hypothesis was that the reported performance came from timing: the described method would fail while a one-day look-ahead would reproduce it. The data rejected the second half. Variant L, which sees a full day of future news, also earns nothing.
Post hoc candidate explanation: a one-row shift in a price feature
Not pre-registered, and not a claim about what the original code did. The original code was not available for comparison, so nothing here shows how its results arose. This is an illustration of magnitude: if the lagged-return feature were shifted by a single row, so that it equalled the next day's return (the target), the same pipeline would learn it directly.
Re-running variant P with only that change gives Sharpe ratios of (EUR/USD), (USD/JPY) and (ZN), with win rates of 91 to 98%, as saved in the daily-returns file. Applying the shift to only a share of days gives numbers of the reported order (5.7, 5.4 and 3.6, per the replication paper's Figure 1). It shows how a one-line error of that kind produces figures of this size, whereas no treatment of the news timing does. Other possible causes could only be assessed with the original code.
How the replication was set up
The full design, committed before any sentiment or model result existed, is in preregistration/PREREGISTRATION.md. An independent replication, Andrews (2026, SSRN 6426038), also found no predictive power, on EUR/USD and other assets. This one adds USD/JPY and 10-year Treasury futures with the paper's event filter, and a direct test of news timing.
Limits, stated plainly
- A rebuild from the paper's text. The paper's code repository was not available when this was written, so the pipeline was reconstructed. Choices the paper leaves open (hyperparameter grid, inner folds, token limit) are the replication's and are listed in the repo.
- Headlines are from URL slugs, not scraped pages. Link rot makes scraping a decade of articles impractical. The validation above suggests the daily index is a close proxy, and Andrews (2026), who scraped headlines, also finds no signal.
- The sample ends in September 2024, not April 2025, because later data is reserved as a hold-out in the author's wider research programme.
- The one-row shift is an illustration designed after the main results and outside the pre-registered verdict.
- Not investment advice. This is a methods replication of a published claim.